01Spend analytics
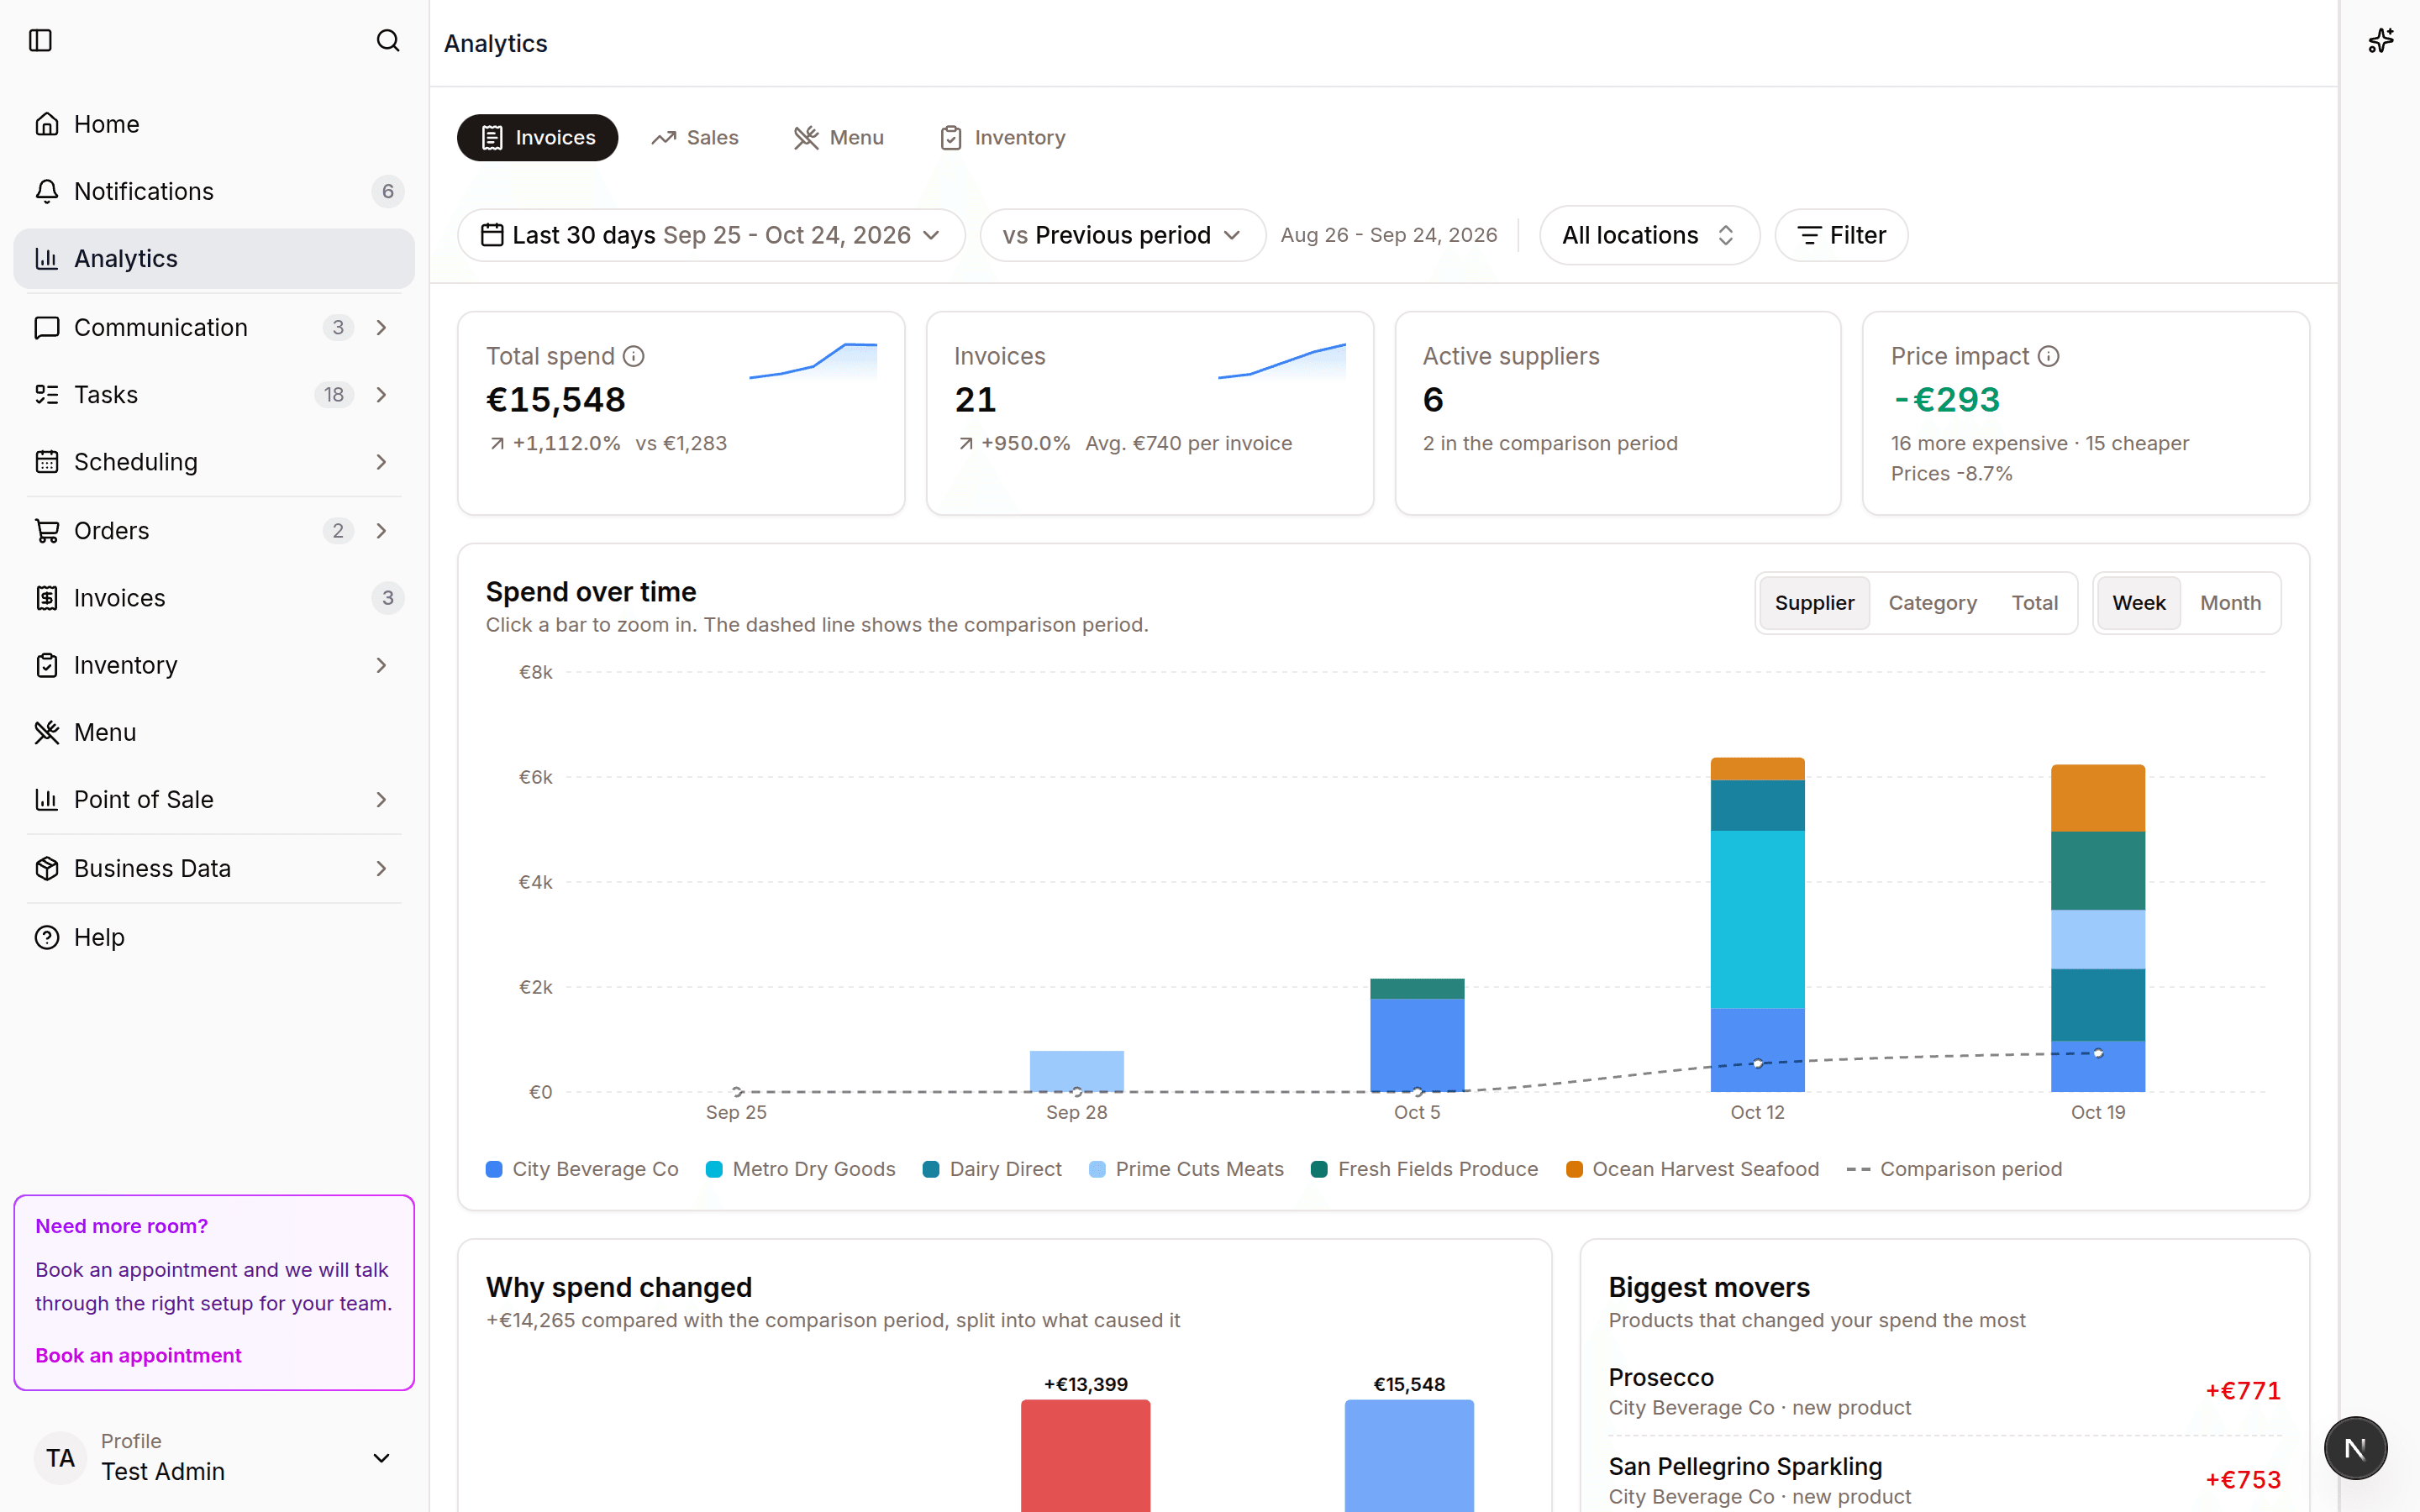
See supplier spend, category movement, and invoice trends without building a report from scratch.
Analytics
See spend, sales, menu, and stock patterns in one hub so management can act without building custom reports.
Operations analytics
This month
Track supplier and category spend from finalized invoices.
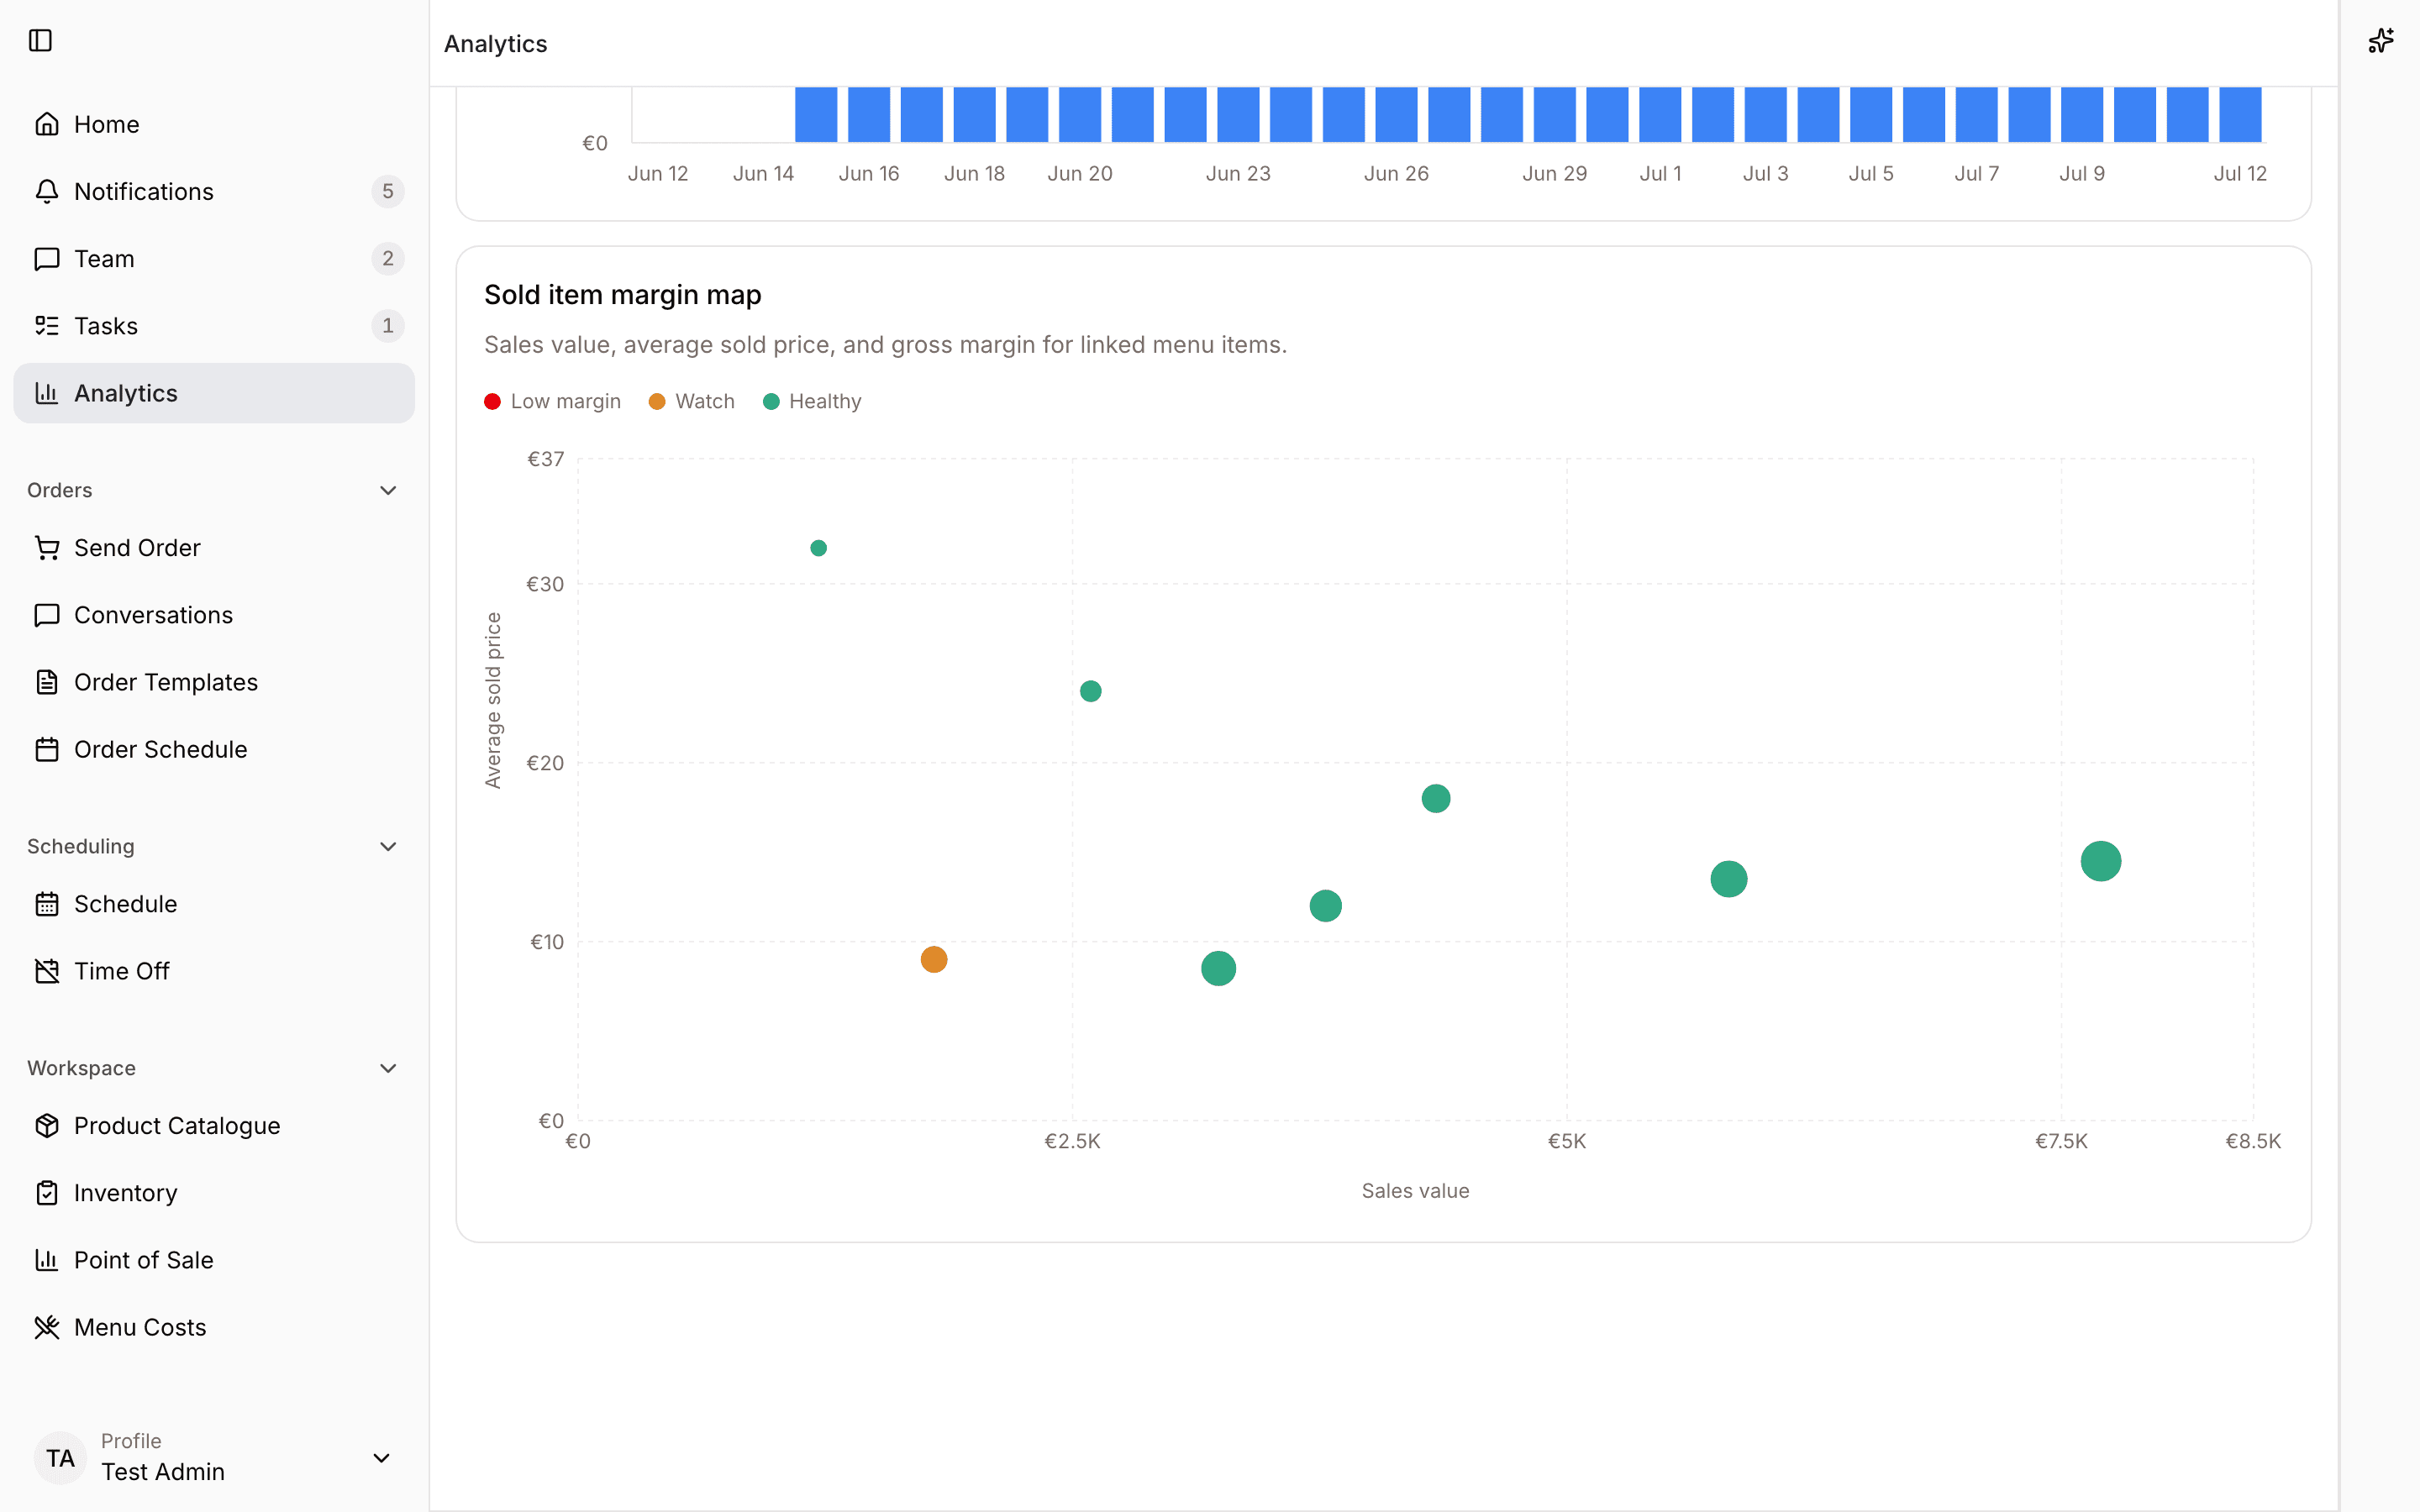
Review menu performance with sales and cost signals together.
Connect inventory counts to value and movement over time.
Product proof
Real product views from a demo restaurant show how the work looks once it moves into Spensa.
See supplier spend, category movement, and invoice trends without building a report from scratch.
Compare sales patterns with cost and menu signals in the same operations hub.
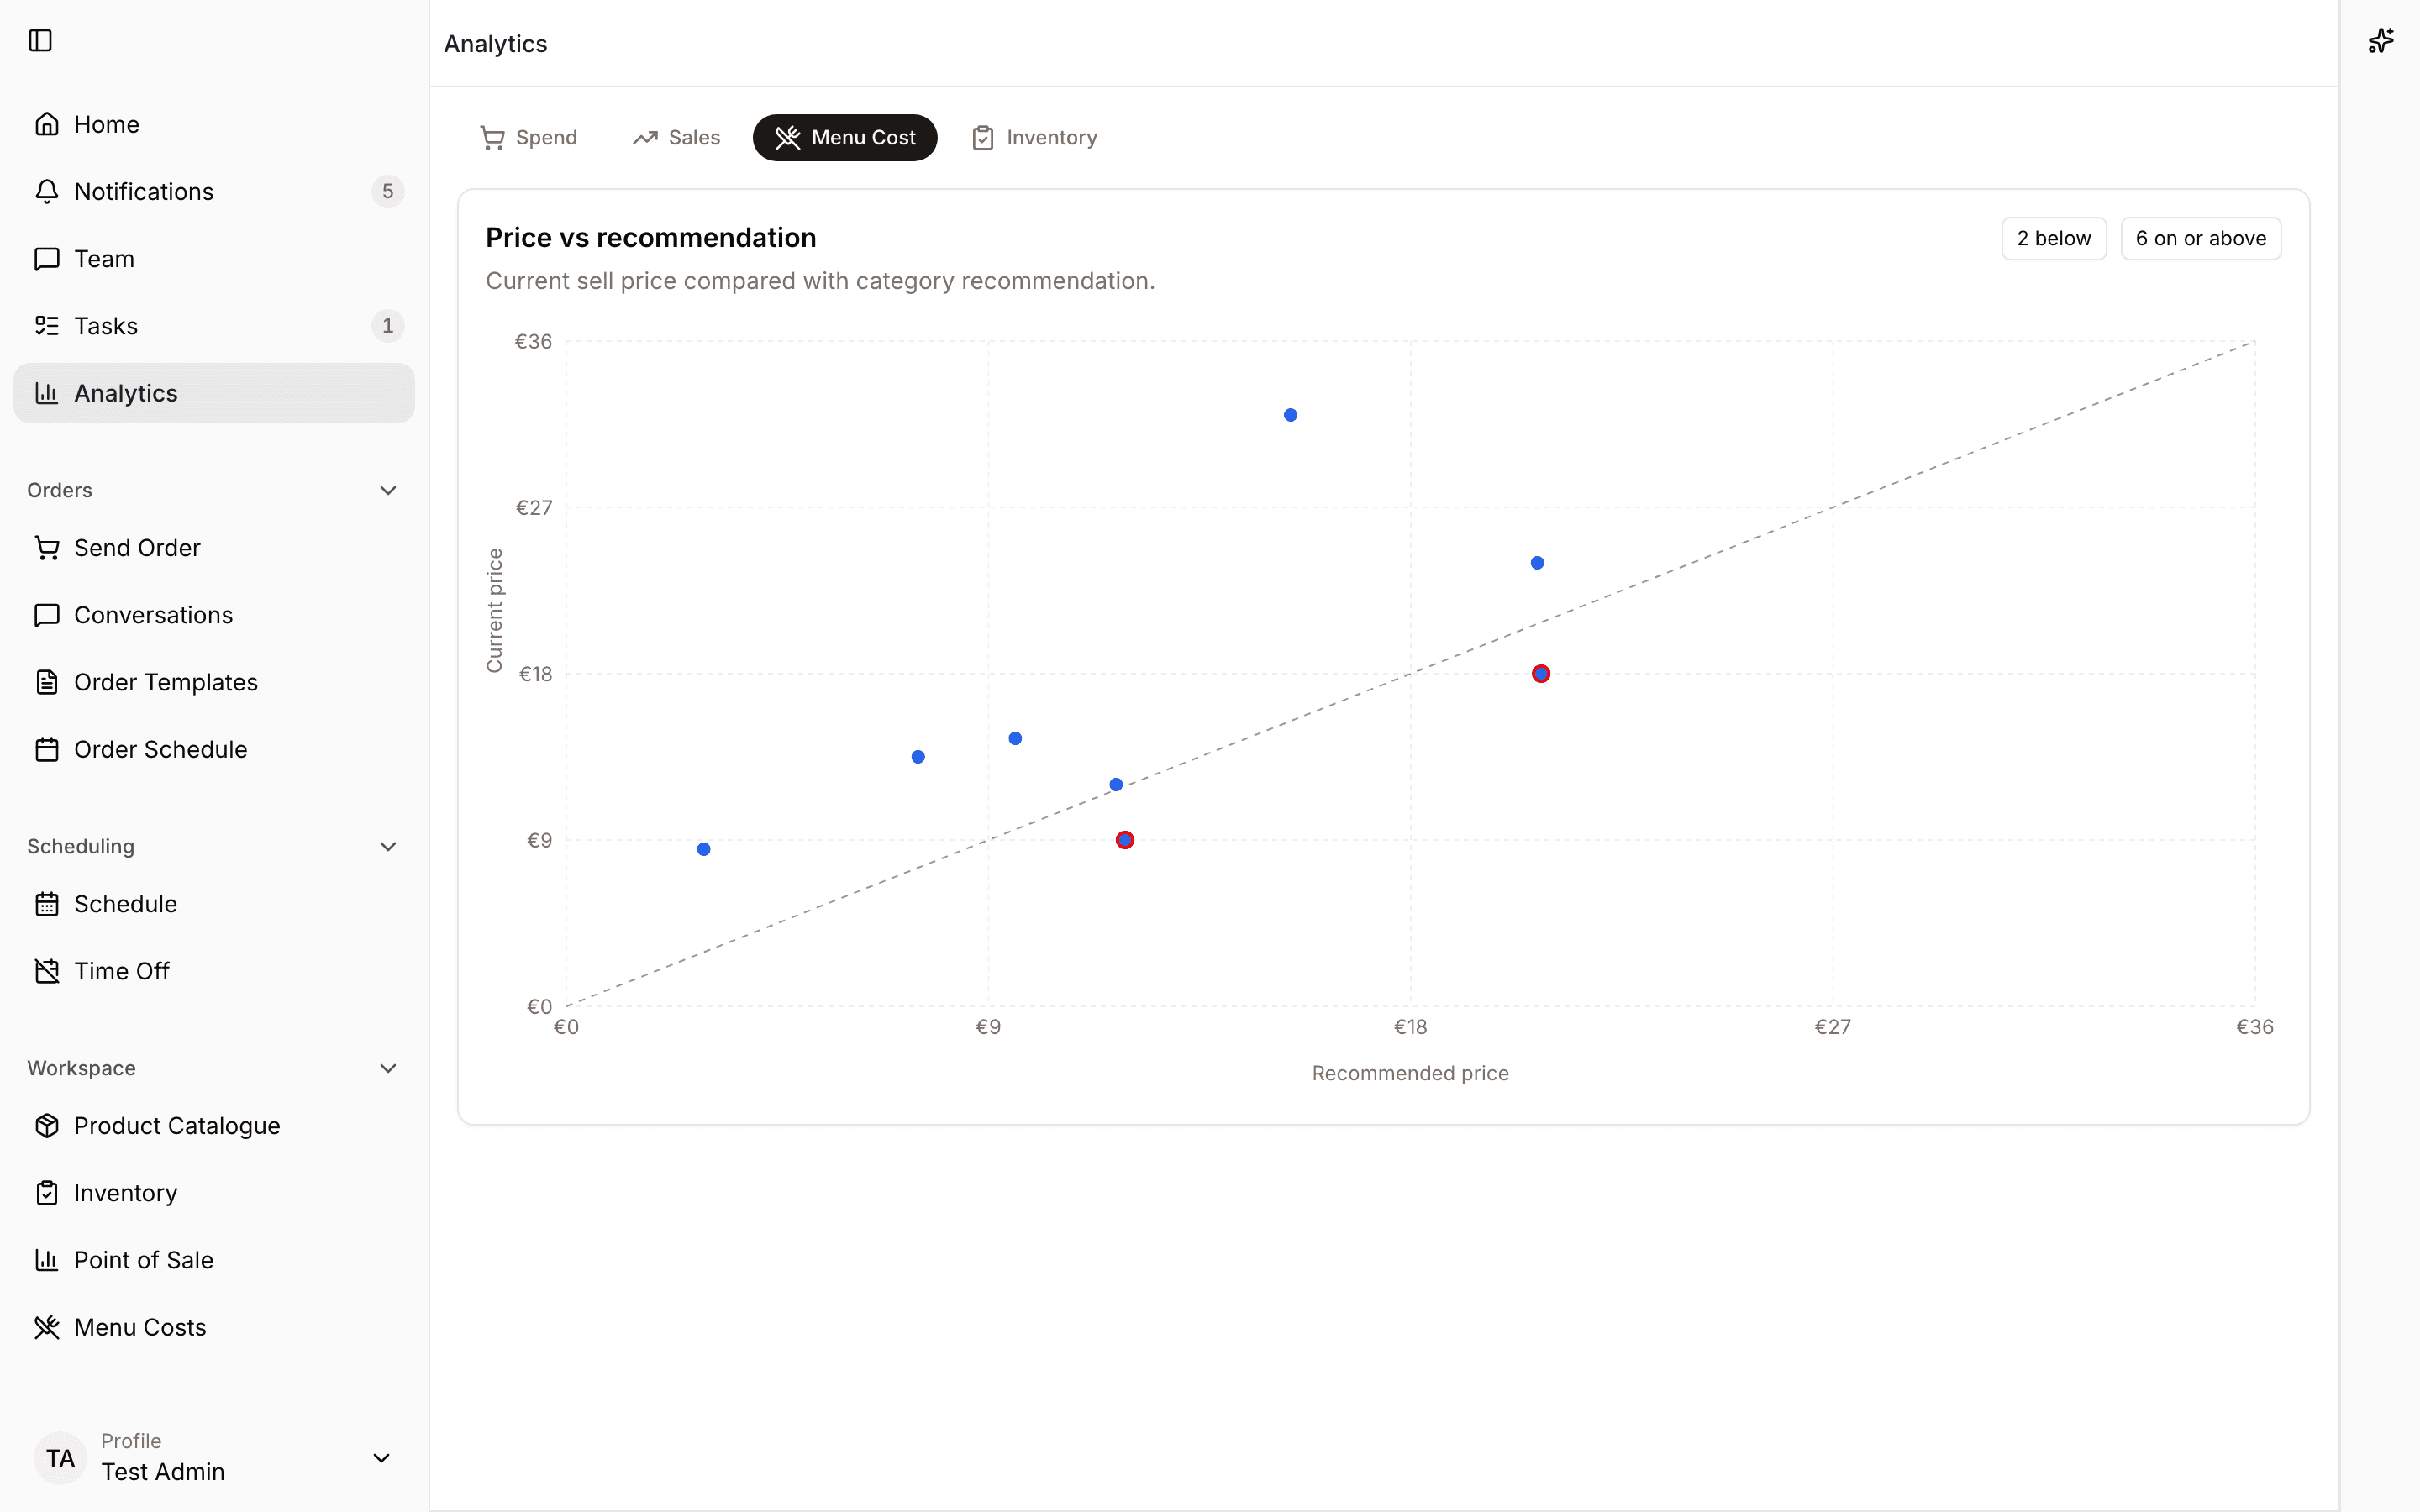
Spot menu items that need review when costs, prices, or sales patterns change.
Workflow
Spensa keeps analytics close to the pages where teams can investigate and act.
More from Spensa
See how Spensa fits your restaurants.
Book a demo